Data Overview and Data Cleaning
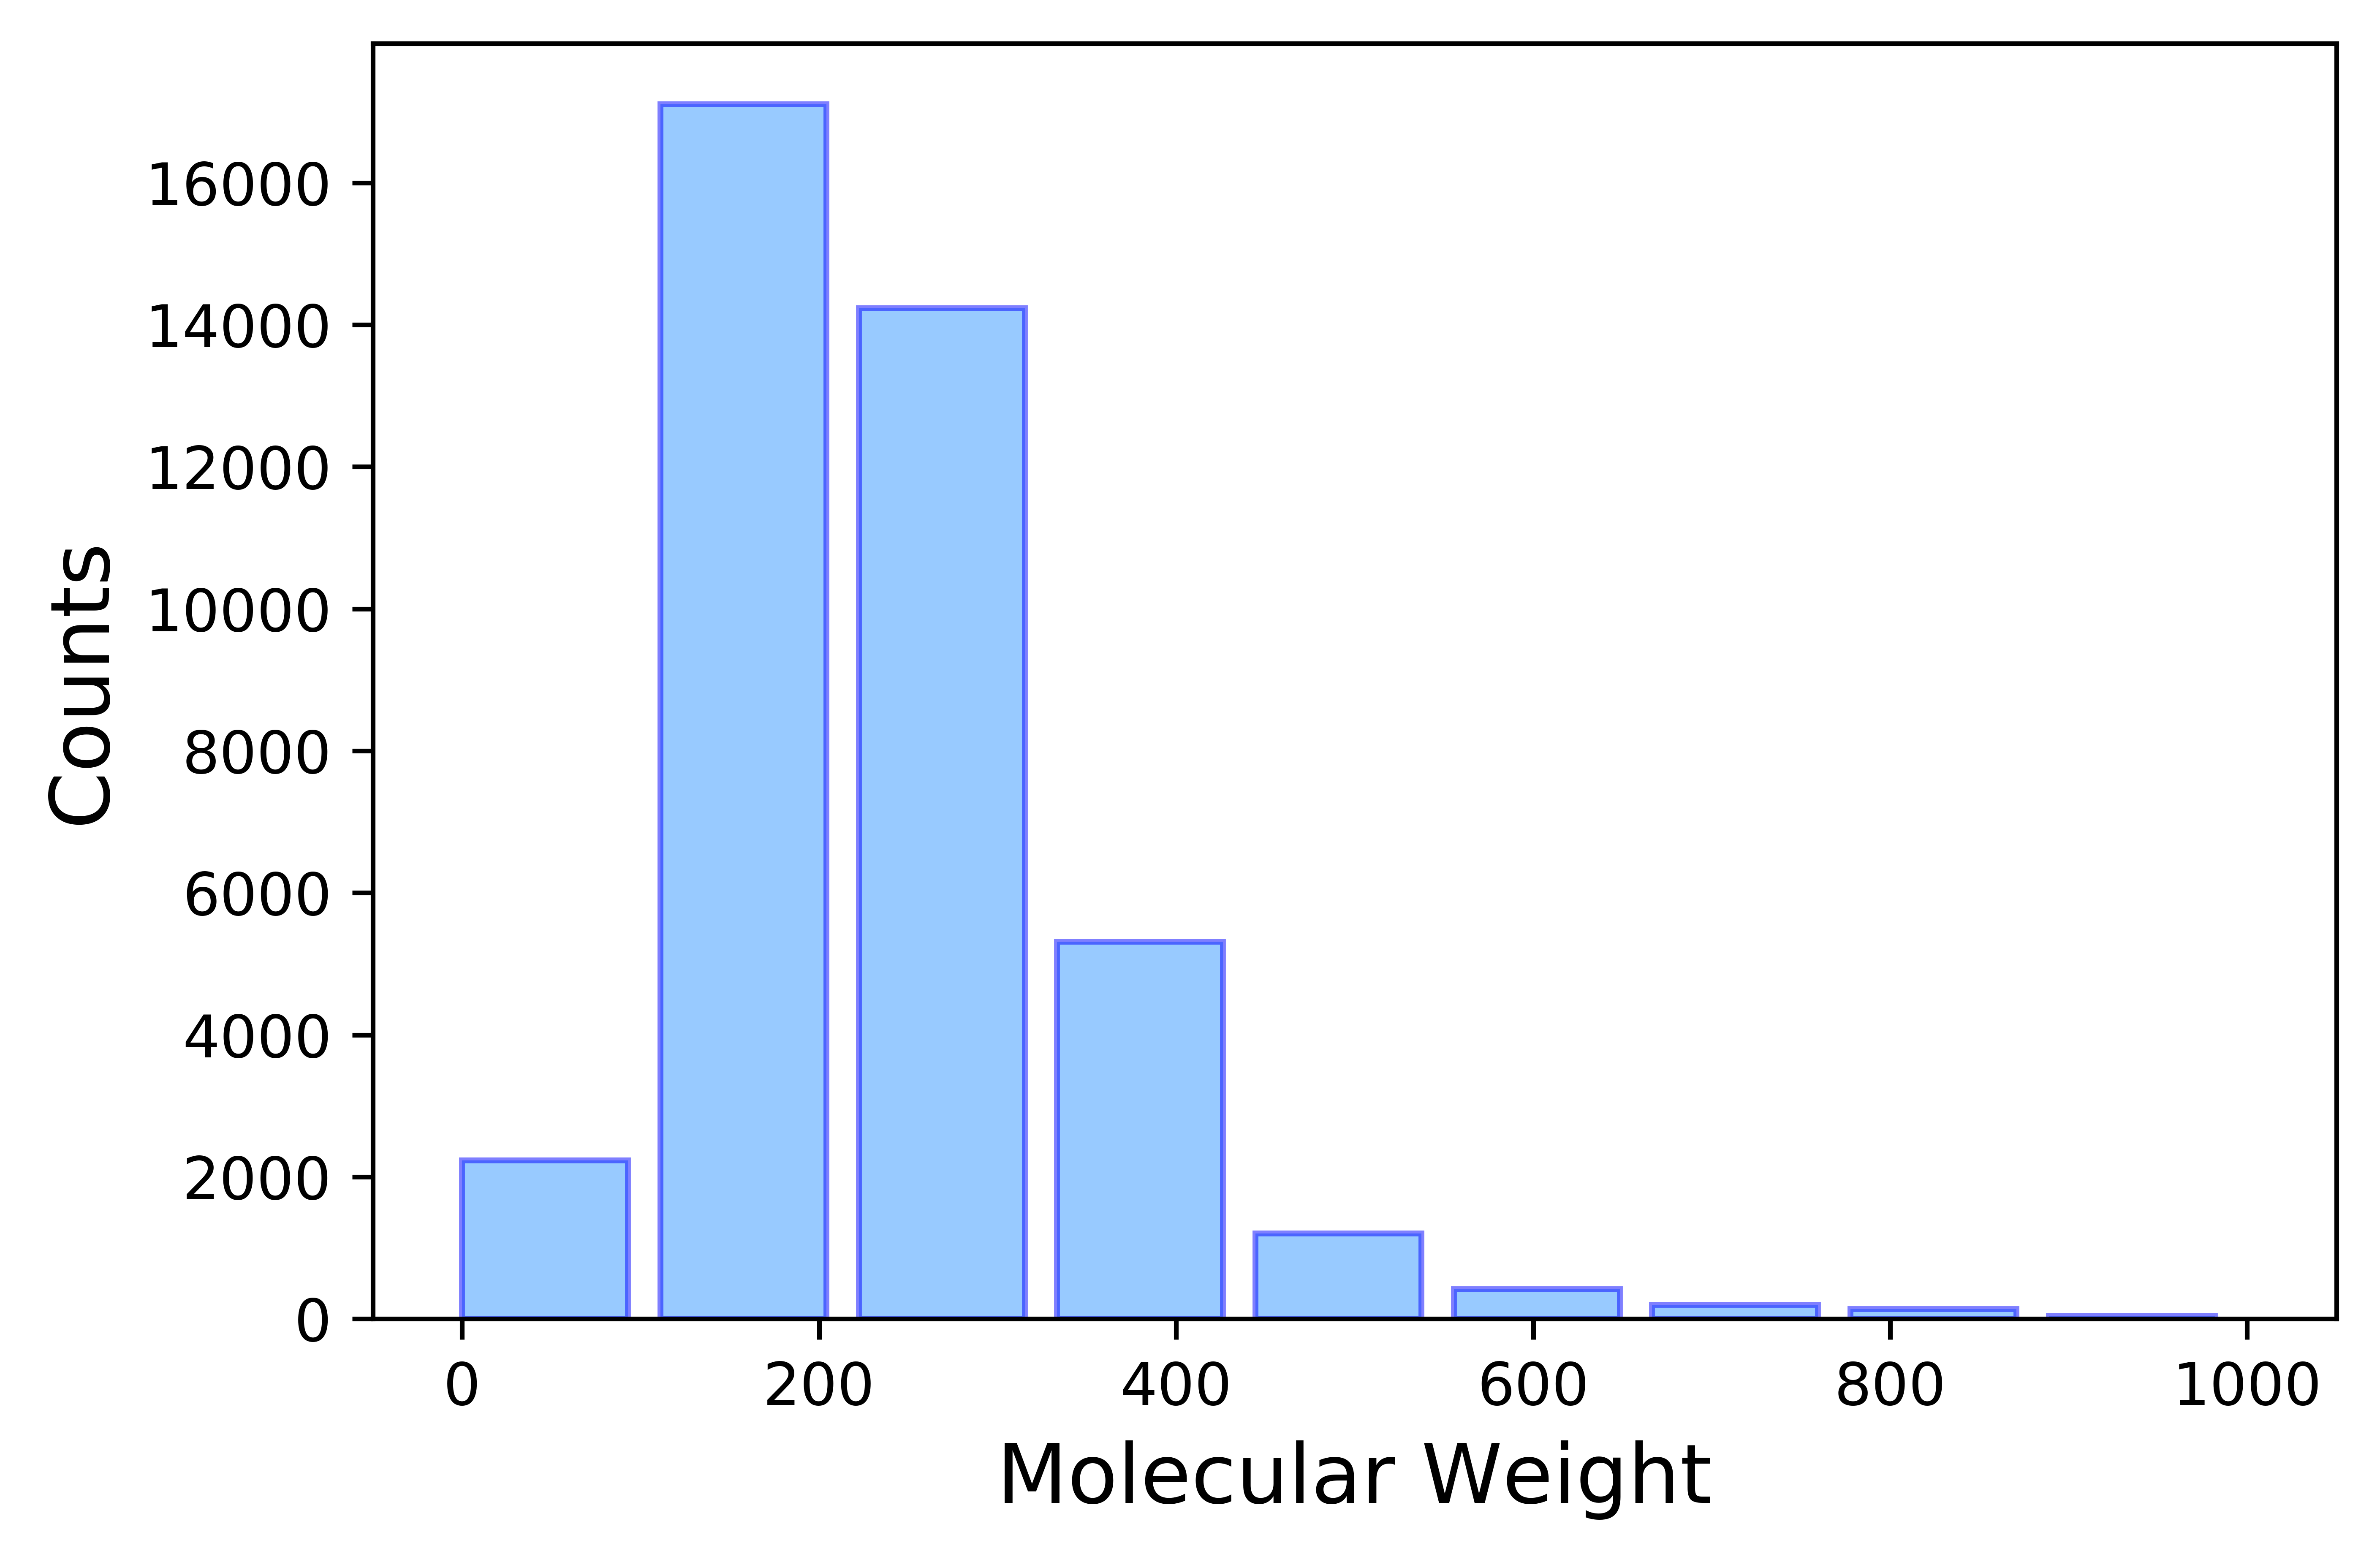
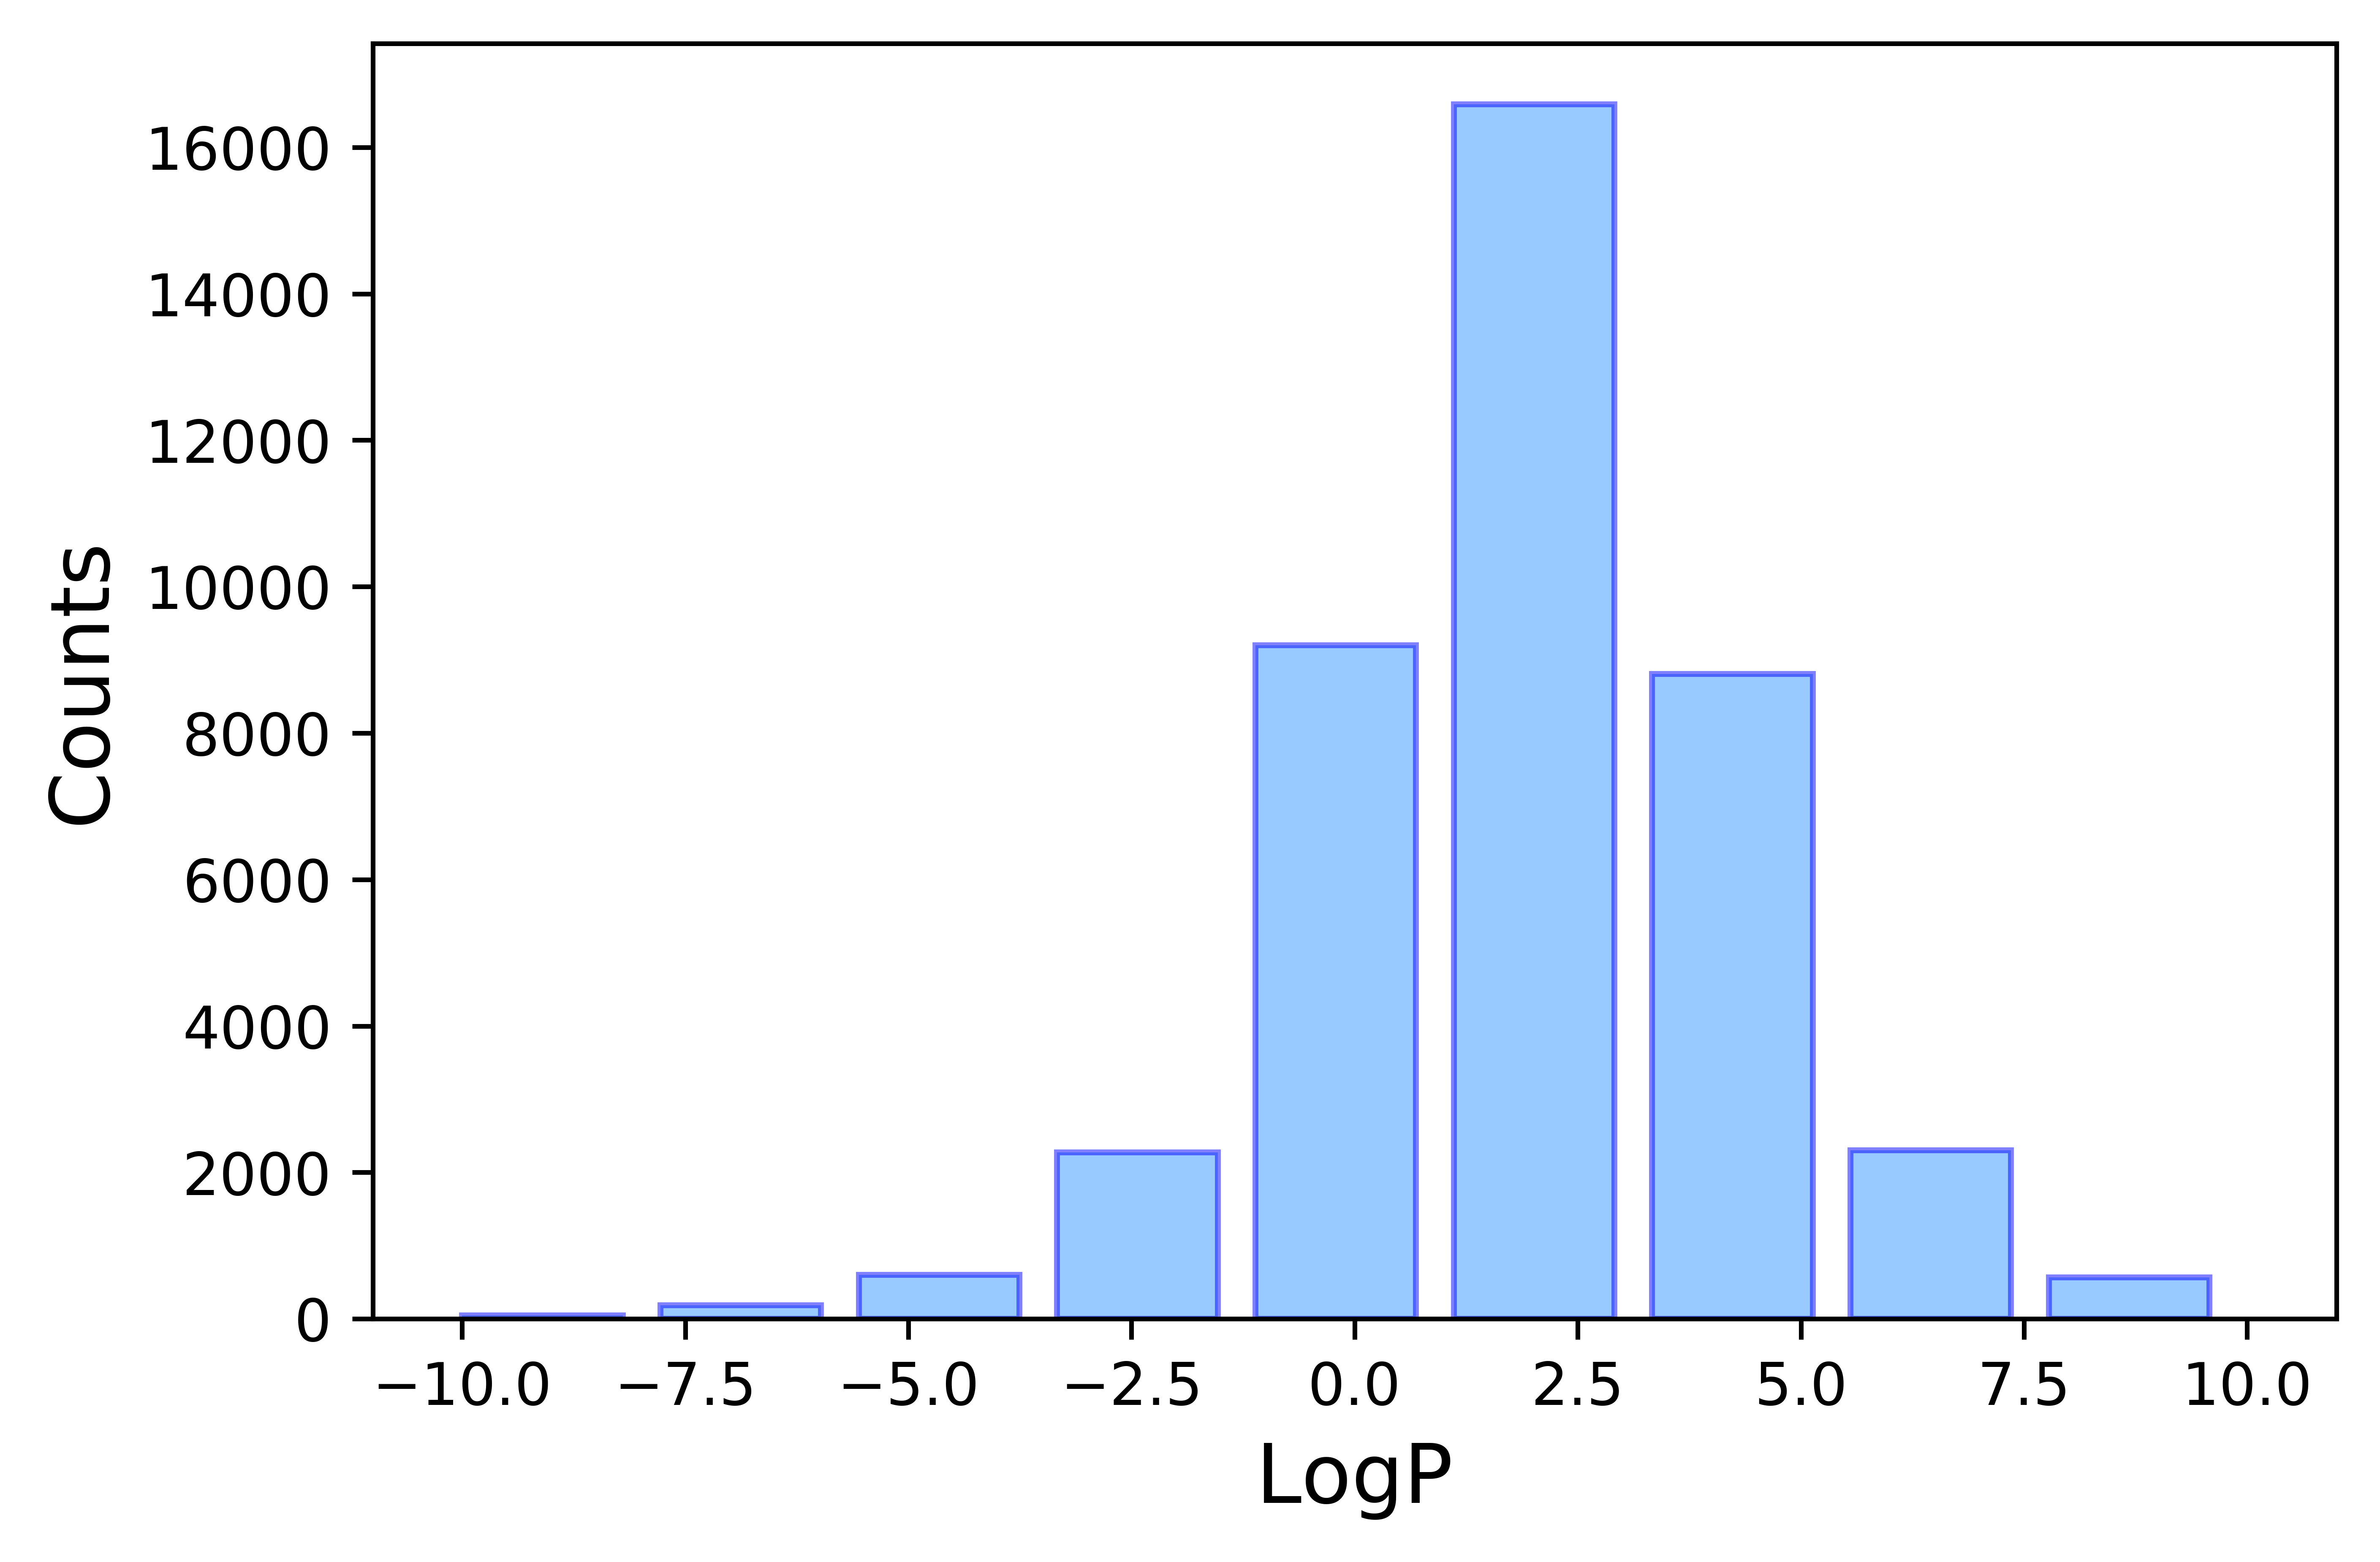
Experimental logP data was taken from PhysProp Database.[1] A total number of 41039 entries were collected spanning a wide molecular range (shown in Figure 1 and 2). Molecules with LogP values falling in the Lipinski's rule make over 80% of the overal sample size, very well representing the drug-like molecule subgroup. Subsequent data cleaning takes four steps.
CAS (Registry Number) matching:
The chemicals with valid CAS id were first cross-referenced with the ChemSpider database using python API, ChemSpipy. In cases where there’s no match or the molecular weight differ by over 1.5 (one protonation state difference allowed), no new compound information will be parsed.
Organometallic compounds and salt removal:
The initial mol list is first read in by rdkit mol-supplier. The heavy metal containing compounds were removed from the list as the number of such compounds are underrepresented and there is a low chance that these will ended up being intaking drugs. Anionic ions like F-,Cl-, I- and salts like NaCl were removed if any to keep consistency.
Conservative charge fixing:
Due to the intrinsic valence bond setting in rdkit, the structure fails if the explicit valence bond number does not agree with the default, unless the atom formal charge is adjusted. Since this is commonly seen on N[+1] and O[+1], the formal charge will be set to +1 if valence bond of 5 or 3 is observed for N or O. Such procedure has to be carried out very cautiously to avoid artifacts.
Abnormal data points sanitization:
For molecules with both mol and smile code malformed or those with no available information in the database, the corresponding entries were deleted. Final cleaning includes very rare instances where Nan logP data was parsed or duplicated molecules was detected.
Outlier and underrepresented data points removal:
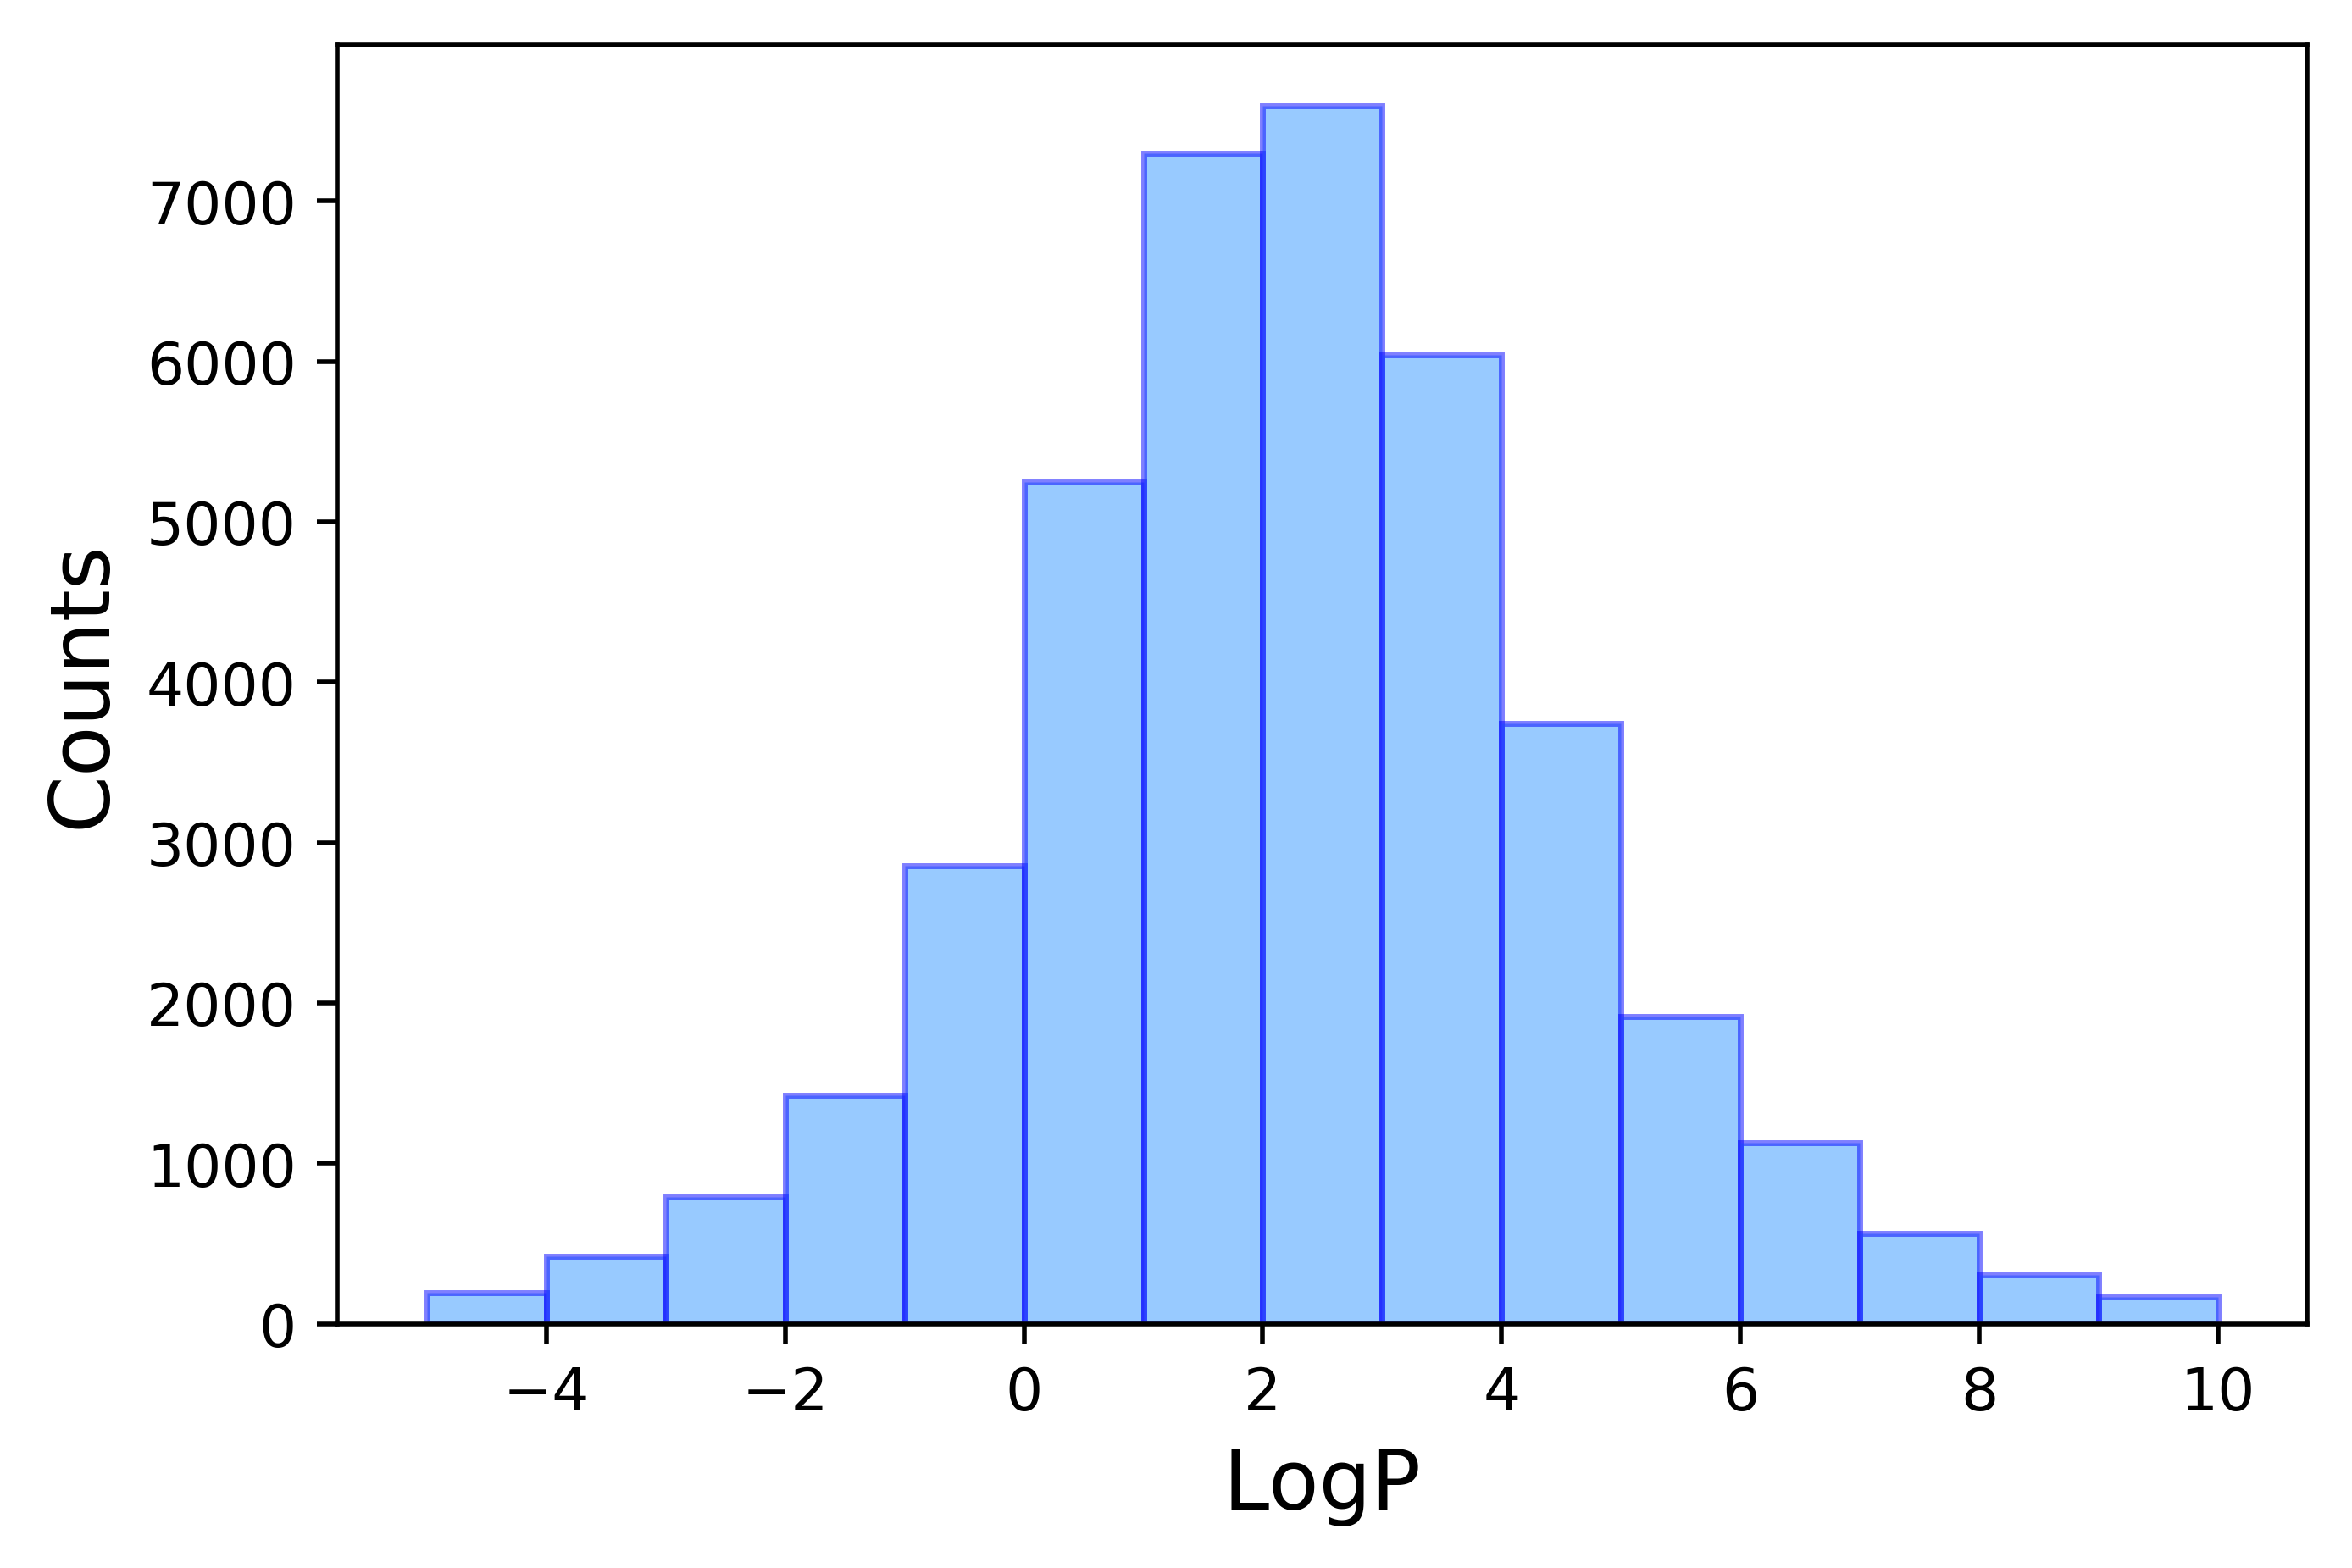
A couple of outliers were found in a quick linear regression test, particularly with large logP values. While over 98% of the data points fall in the logP range between -5 and 10, the outliers belongs to underrepresented groups and have been poorly estimated. Since the drug-like molecules with -0.4 < logP < +5.6 is of the major interest here, anything < -5 or > 10 will be removed.
A total of 1341 entries were removed, resulting in 39698 compounds for study.
The final logP distribution is shown in Figure 3.
Reference:
[1]. https://www.srcinc.com/what-we-do/environmental/scientific-databases.html